IN-STORE
ANALYTICS
We turn paths into KPIs
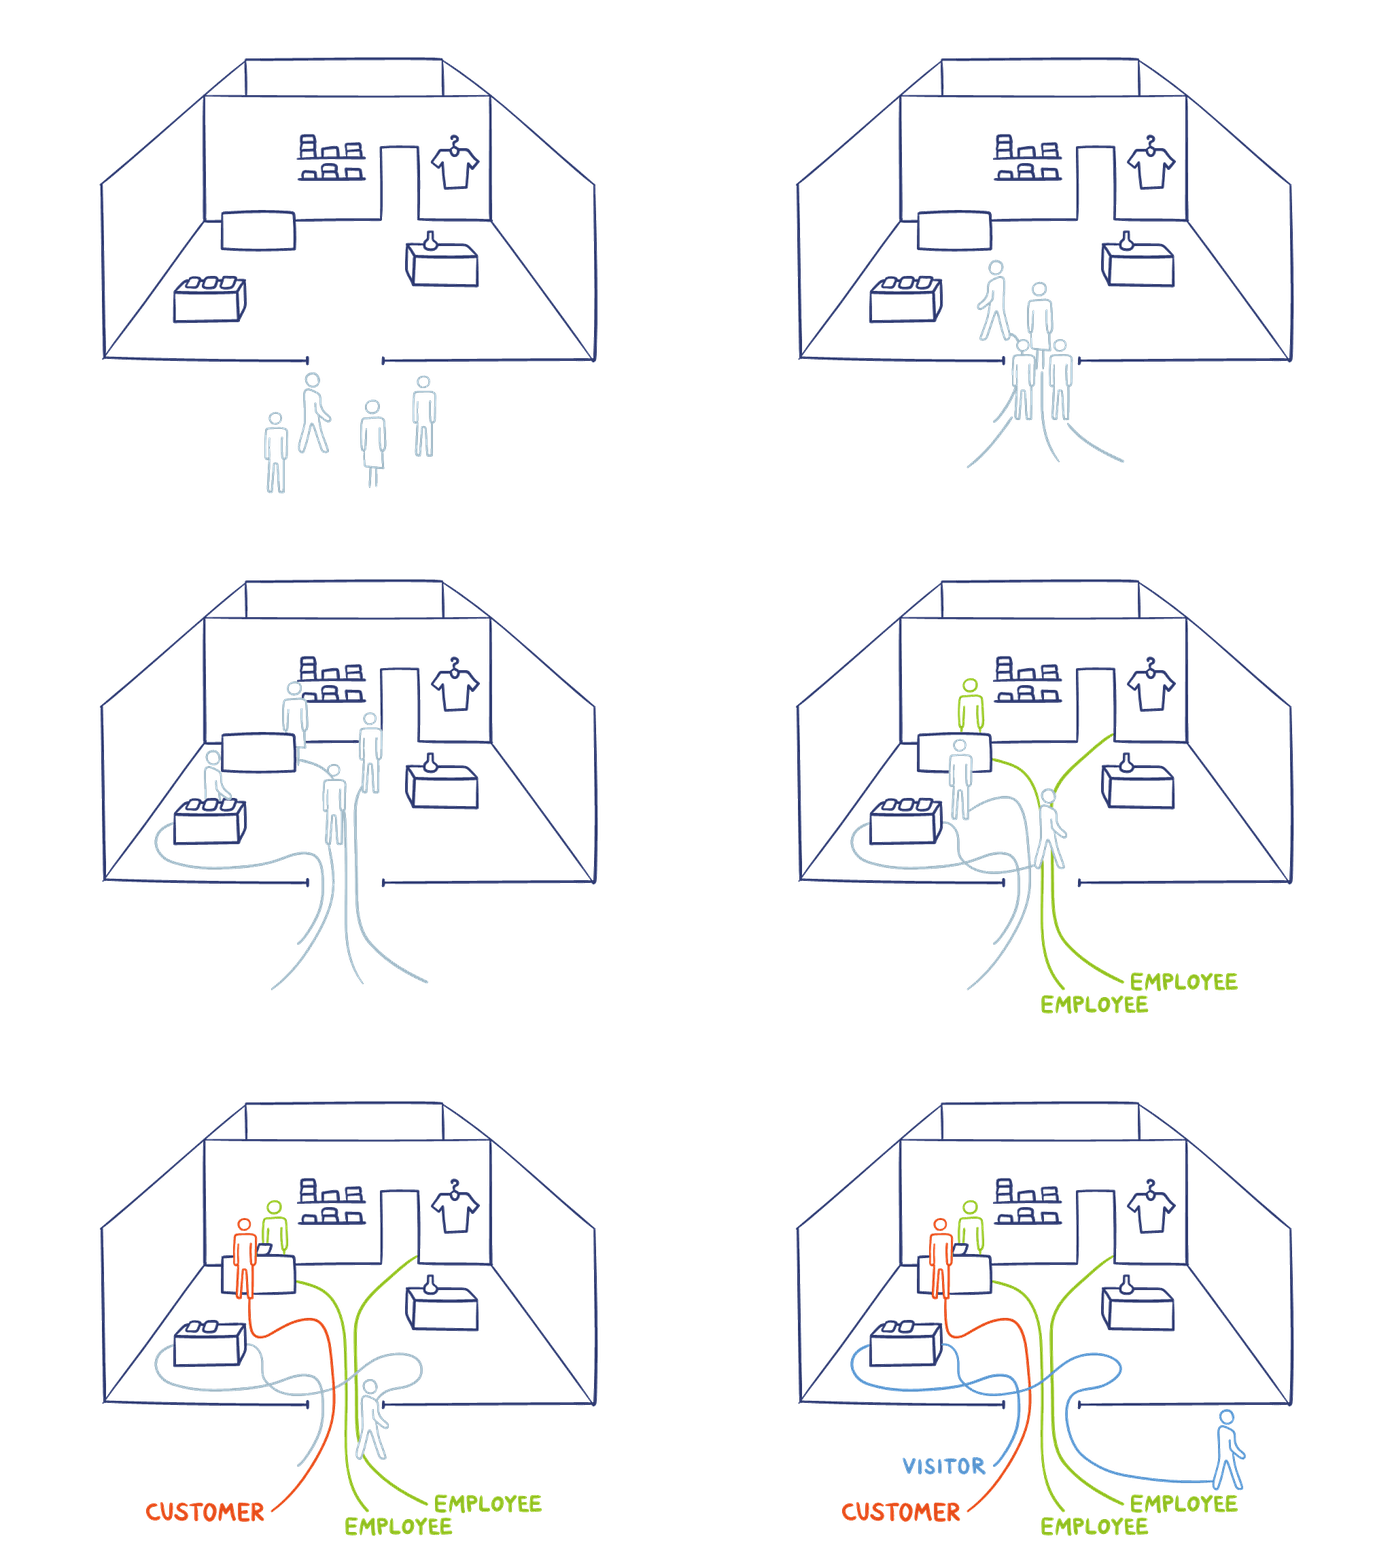
SPECIFY AND ANALYSE VISITOR CLASSES
Specify visitor classes based on their paths and group your customers accordingly.
STAFF EXCLUSION DONE THE RIGHT WAY
Detect employees by their movement patterns and automatically adjust your visitor numbers
THE CROSS ZONE FUNNEL KNOWS IT ALL
Analyse correlations between various zones and learn about typical paths of your customers.
SMART AND FILTERABLE HEAT MAPS
Visualize the paths of your visitors with meaningful and individually filterable heat maps.
TURN PATHS INTO INSIGHTS
Path Analytics is our innovative way to track and classify visitors based on their individual WALKING PATTERNS. sensalytics uses high-precision 3D sensors to calculate the DWELL TIME and path of each individual visitor - accurate to the nearest centimeter and second. With just a few clicks you can define your CUSTOMER GROUPS and analyze the dwell time, number of visitors and CROSS-ZONE FUNNELS with dynamic MOTION-HEAT MAPS.
OBJECT-RULE-ENGINE: THE INTELLIGENCE BEHIND
The Object Rule Engine (ORE) is based on raw data from our smart 3D sensors, which can be stitched together to cover and monitor an almost infinite area. These sensors record all movements of your visitors - to the nearest centimeter and second. Logical zones and entry lines are used to structure these movements. The object rule engine operates on this data.
With simple path and duration values, you can now individually and at any time - also retroactively - determine how a visitor should be classified or grouped.
The ORE by sensalytics turns the walking paths of your customers into reliable and meaningful figures. So you get clarity in the usual “visiting noise“. Detailed information can finally be clearly assigned.


THE ANALYTICAL BEGINNING
The Path Analytics cockpit provides you with the ideal entry into the path analysis. Organize, filter & rotate your desired data with just a few clicks. With sensalytics you will get dwell times and number of visitors in all illuminated spots of your premises. You will not only get the average length of stay, but also the number of visitors with specific dwell time clusters. Target visitors with low or high dwell time. Take a look at which hotspots exist and show or hide specific groups of visitors.
“WHERE WERE THOSE WHO WERE THERE TOO?“
How many people with a dwell time of more than three minutes were in section A and then in section B? What percentage of all buyers were in both section A and section B? These and many more questions are answered by the sensalytics zone funnel. There are various fine adjustment and filter mechanisms available. Limit the analysis base to specific visitor classes or dwell times, and look at how, when, where, and how long the filtered visitors spent with you.

BE THE DIRECTOR OF YOUR OWN HEAT MAP
When it gets more detailed, you may rely on crosstabs and charts. For a visual and geographic orientation, on the other hand, a ground-plan heat map is required: At sensalytics, we go two steps further than is the case with otherwise conventional, rather clumsy representations. Our system displays dwell times, occupancies and the number of visitors on a structured heat map. These data can be individually filtered according to visitor classes and dwell times. So you finally see in the “rush of the movements“ what you always wanted to see: the actual shopping behavior of individual customers and not just a general presentation of many people.
This finally turns a heat map into an analytic diagram. The complete tracking history will be played here as a heat map movie. Be the director and get the insights you've been waiting for.
THE SENSALYTICS PACKAGE
sensalytics is a combination of sensors, such as people counter, and software. The sensors are easily installed at the location. From then on, these sensors provide data in real-time to the sensalytics system. You can access these data, the nicely presented figures and diagrams via a comfortable web portal or mobile apps.

SENSORS
EASILY INSTALLED
LOW-MAINTENANCE OPERATION
READY FOR IMMEDIATE USE

PLATFORM
INTUITIVE AND POWERFUL
REAL TIME DATA
ACCESS FROM PC, TABLET AND SMARTPHONE
